

Astronomy has quite a lot in common with the social sciences. For starters, it is an observational science because -for obvious reasons- experiments are mostly confined to the sublunar world. Some branches of economics -notably, behavioural economics- are indeed experimental, but otherwise experiments in the social sciences are often either impractical or unethical.
Another parallel is that both cosmic and human history are given only once, in the sense that overall conditions change in such a way that every moment in history is different. For instance, star formation in primordial gas –characterised by chemical abundances that were set at the Big Bang- is understood to proceed in a very different way with respect to present-day star formation, which happens in gas that was enriched in heavy elements by previous generations of stars.
Finally, both in human matters and in astronomy, we are part of the system we want to study. While our behaviour may not influence the system that much, our place in the universe determines our point of view: the sky would look very different if the Earth orbited a star in the Galactic center rather than the Sun, and the policy implications of the Phillips curve look very different to a young unemployed person and to someone who is about to retire with a lot of savings. We can’t have a bird-eye view, so to say.
Given these similarities, it is somewhat surprising that methods from one field are seldom applied to the other. One reason may be the pervasiveness of detailed, predictive theoretical models in astrophysics, a situation that is not shared by the social sciences. If you have a model, you may think you don’t need to combat confounds using clever statistical tricks. Or maybe the two communities simply do not interact much. At any rate, I am doing my tiny part to change this.
To the best of my knowledge, this paper I wrote a year ago is the first appearance of the statistical technique known as regression discontinuity in the refereed astronomical literature. I previously published an unrefereed RNAAS note on this -together with my wife, who happens to be a geographic economist.
The concept had been proposed –independently and unbeknownst to me- by Sibylle Anderl in 2015 in a preprint addressing the role of astrophysics in the philosophy of science, but had never been applied to actual astronomical data.
What is regression discontinuity though? While you can easily find a formal treatment in any econometrics book, I will try to give some intuition of the method here, based on my understanding of it. Our starting point is that we cannot run experiments –in the sense of randomised controlled trials where one sample of experimental units is assigned to some treatment and another acts as a control- so we are looking for natural experiments. We are trying to find a situation where some experimental units –stars for instance- were assigned to treatment at random. So we need to find a source of random numbers in nature.
Now if I told you that I measured the length of my desk to be 132.589 cm, which digits in the number I reported would you trust to be correct? If I used a typical ruler, it is likely that my measurement error was around one mm, so the 8 and 9 are utter garbage and I should have reported my measurement as 132.6. But even if I used a very precise calipers, the reasons that make the first digit from the left a 1 are very different from the reasons that make the last digit a 9. While there are physical reasons related to manufacturing, etc. that ensure that desks are between one and two meter long, the manufacturer has neither the interest nor the means to ensure a precision of ten microns on the length of the desk. The last digits will depend on the amount of moisture in the wood the desk is made of, the temperature of the room, the number of times the surface has been cleaned and who knows what else. For all practical purposes those digits are effectively random.
Regression discontinuity leverages these least significant digits as a random number generator. Whenever experimental units are assigned to treatment based on a cutoff in some property, like students admitted to an exclusive college based on their grades exceeding a minimum threshold, regression discontinuity can be applied (with caveats: more on this later).
The idea is to compare the treated and untreated units in the immediate vicinity of the threshold, assuming that the exact value of the underlying variable –its least significant digits if you will- is random, so that they have been effectively assigned to treatment at random.
The student admission example makes this easy to see: those students who were just above the threshold and were admitted and those who were just below the threshold and were rejected, likely differed little in their core characteristics. Some were just lucky.
So we can just fit a broken line to the relation between whatever outcome we care about –e.g. income after twenty years from admission- and the variable to which the cutoff applies –the grades in this case. By broken line I mean that we let the intercept be different on both sides of the cutoff. If the treatment had no effect at all, the best fit coefficients on either side should differ only due to statistical noise. Otherwise we will observe a jump at the cutoff, the bigger the effect of the treatment is. Rather than using a straight line, the procedure is often extended to other functional forms, some of which end up being ridiculous misspecifications. With great powers come great responsibilities, apparently.
In fact, while an apparently simple method, regression discontinuity can be subtly misleading if not carried out properly. One issue is that there is a sort of bias-variance tradeoff related to how we define being in the vicinity of the threshold. If we zoom in too much, the units on the near and on the far side of the threshold will be very similar, but we will have very few data points to work with. This will result in statistical fluctuations that can drown the signal we are interested in revealing or –worse- can make us believe there is a signal where in fact there is none. Conversely, if the data we include in our analysis is relatively far from the cutoff, the treatment assignment rule is no longer random -the students that scored far above the admission threshold were indeed better than those who scored far below- and selection bias may be introduced if we do not account for this properly.
At any rate, let’s take a look at this figure from my paper:
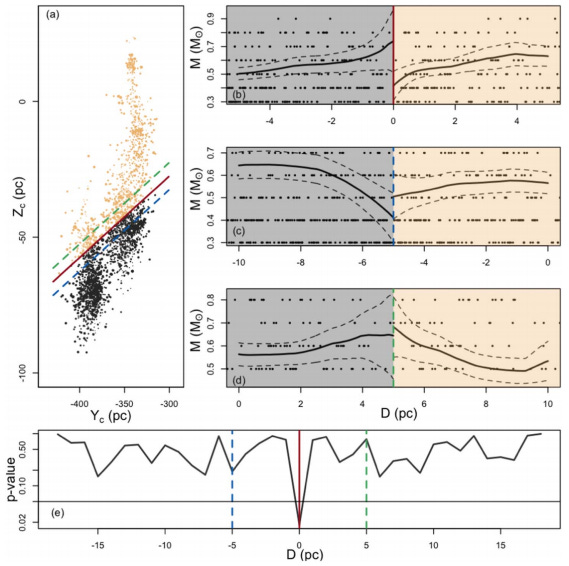
Top left panel shows the plane of the sky and each dot represents a star observed by the Gaia satellite. From observations in a different band we believe that the red diagonal line corresponds to the boundary of a supernova shell –supernovas are huge stellar explosions that shock interstellar gas and the boundary of the shell separates the gas that was hit by the shockwave from the surrounding medium.
The three panels on the right correspond to three regression discontinuity exercises: in the x axis we have the distance from the red line –the actual supernova shell- and on the y axis the mass of stars. The mass is actually a model-dependent quantity, which is inferred from the magnitude and color of a star but let us gloss over this for now. The top panel shows that indeed there is a jump at the red line: the confidence areas around the black solid lines do not overlap.
The second and third panel show the results of the same exercise five parsecs away from the red line, corresponding to the dashed blue and green lines respectively. At those positions there is no jump –not a significant one at least. Yay! This is a typical check that economists run and it is aptly called ‘placebo cutoff’. The bottom panel shows the significance of the jump at even more placebo cutoffs. They are never significant at the 5% confidence level, even if I expected at least one to be out of sheer chance –something that should happen with probability 1-0.9532 ~ 0.8 since they are 32.
Supernova explosions can have a strong effect on interstellar gas by heating and compressing it, as well as by polluting it with heavy elements. So it is not unreasonable to think that this supernova may have had an effect on the masses of the stars, an effect that we may have revealed with regression discontinuity.