
Seeing is believing
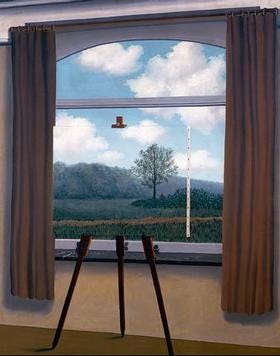
I heard you like images, so we put an image in your image so you can look while you look.

The ten people who read this blog know I am –to put it mildly- obsessively interested in the visual display of quantitative information, and its epistemology. No really, that’s a thing.
For instance, my last post was about the misleading output an otherwise valid visualisation technique can yield when used uncritically.
The challenge with visualisation is that it blurs the lines between what we perceive directly and our abstractions about what we perceive, by making some representation of those abstractions visually available. The map is still not the territory, even though some maps are printed at a 1:1 scale and spread out on the floor.
Consider the first picture of a black hole, taken by the event horizon telescope (EHT) back in 2017. Quoting the CNN article[1] (emphasis mine):
``In April 2017, scientists used a global network of telescopes to see and capture the first-ever picture of a black hole, according to an announcement by researchers at the National Science Foundation Wednesday morning. They captured an image of the supermassive black hole and its shadow at the center of a galaxy known as M87.
This is the first direct visual evidence that black holes exist, the researchers said. In the image, a central dark region is encapsulated by a ring of light that looks brighter on one side.’’
Hold on a second. EHT is a network of radio telescopes. I don’t know about you, but my eyes do not detect radio waves. So how direct is this visual evidence?
The original paper explains clearly that EHT is an exercise in very large baseline interferometry, which is ultimately a very sophisticated form of computational photography.
This is very different from looking at the black hole with your own eyes, even though you are indeed looking at a picture on a computer screen with your own eyes. In reality you are looking at reams of theory. I don’t know to what extent you need to account for relativistic effects to correlate signals, but the need for atomic clocks and synchronisation with the GPS suggests that you can’t fully ignore them. Relying on general relativity at the data processing level to produce an image that is regarded as direct visual evidence of a general relativistic prediction (Kerr black holes) sounds circular. This does not mean that it is circular, but it is something to be aware of. By the way, the image just got improved using AI. The donut got skinnier, which is good news to all of us who are struggling to control our waistlines, I suppose.
Speaking of AI and astrophotography, a few months ago there was a controversy about a new model of Samsung smartphone that apparently uses a neural network to silently enhance images of the Moon that happen to be captured in a shot far beyond the capabilities of the camera. I can’t believe I missed that one when it came out.
Back in 2020 I had my students measure the sugar concentration of a solution simply by snapping a picture of a partially immersed rod in a transparent beaker. Some geometry and –voilà- you can estimate the refraction index, which can later be calibrated to the concentration. It was COVID season and we could not use the university’s labs, so this was the best approximation to a real lab experience I could deliver. Only one student told me he didn’t have a smartphone and ended up having to borrow it. Few people used a dedicated digital camera.
When asked to speculate about possible sources of error –either random or systematic- I don’t recall anyone mentioning that the whole digital photography process is a huge black box we have no control over. At the time it did not seem to be an important issue. Perhaps now it is.
[1] Der Spiegel is not that different, calling the picture ein historisches Bild and going on to claim that Bisher gab es nur Illustrationen der Schwerkraftmonster. So this one is supposedly not an Illustration… it must be the real deal.
I wonder if maps are the equivalent of this in geographic economics?